1. Go to the Data Files page. Click Manage Files, then Graph Files.

2. Choose a file to graph.
Only log files can be graphed. All other file types are automatically filtered out. All of the files you select will be graphed as a single data set to one location.

3. Click Next.

4. Choose a graph location for the data. You can use an existing location or create a new one.
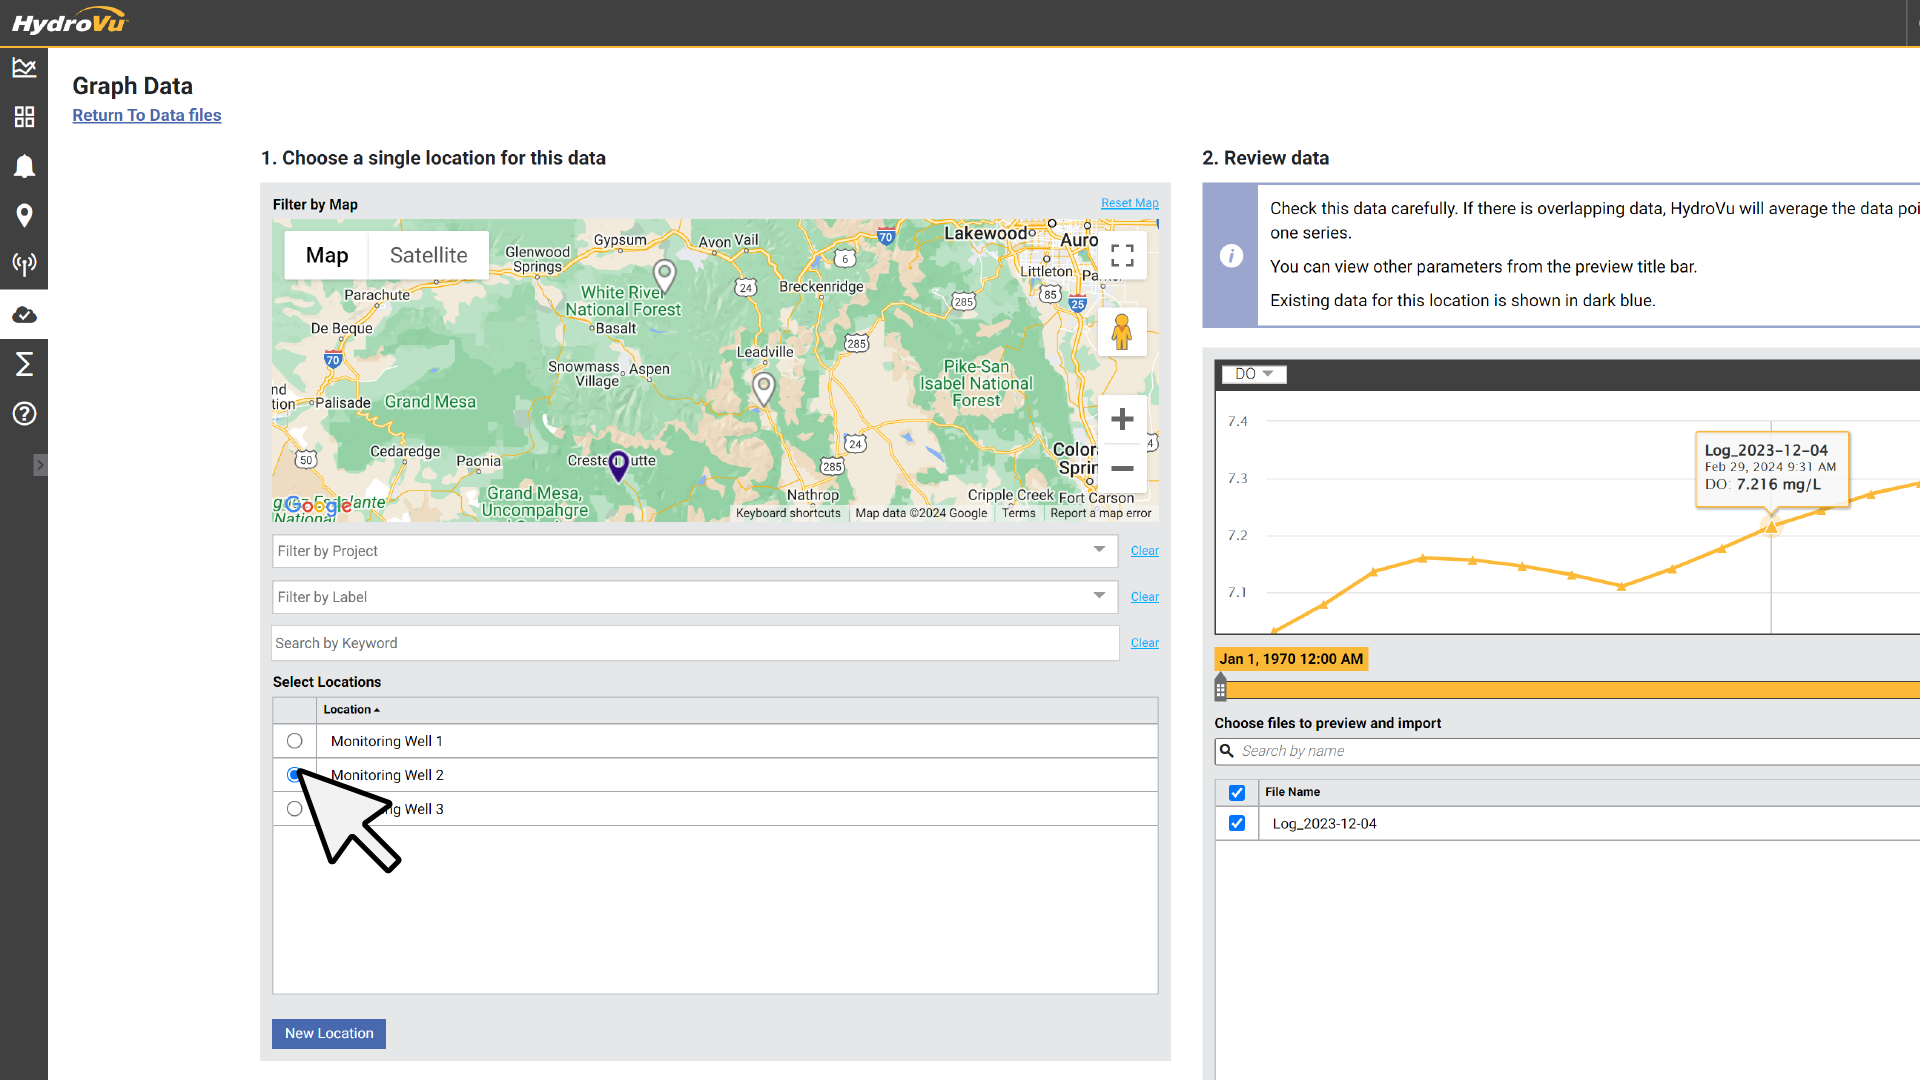
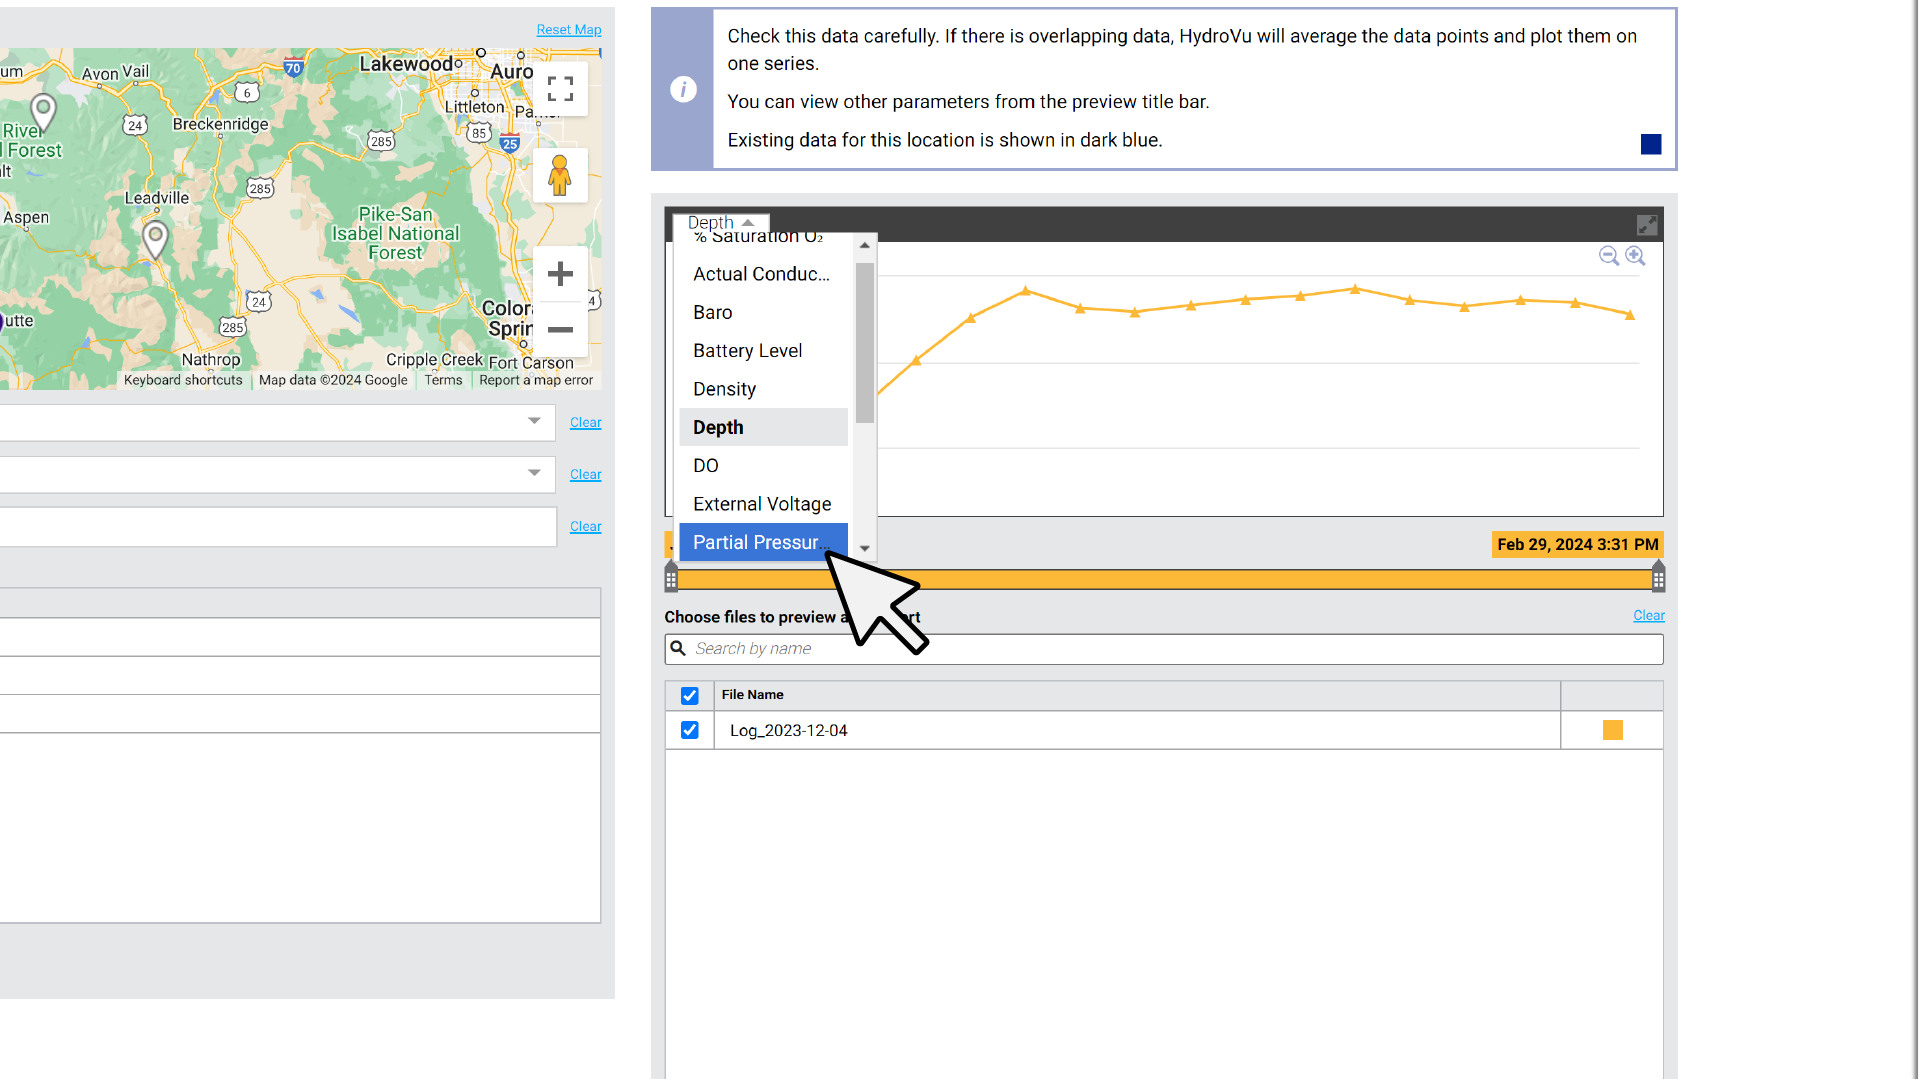
5. Review the data. You can use the dropdown menu to change which parameter is shown.
All data will be graphed as a single data set. If there are overlapping timestamps, the overlapping data will be averaged and plotted in one series. Existing data for the selected location is shown in dark blue.
6. Choose Graph to Location and confirm that you are ready to graph the data.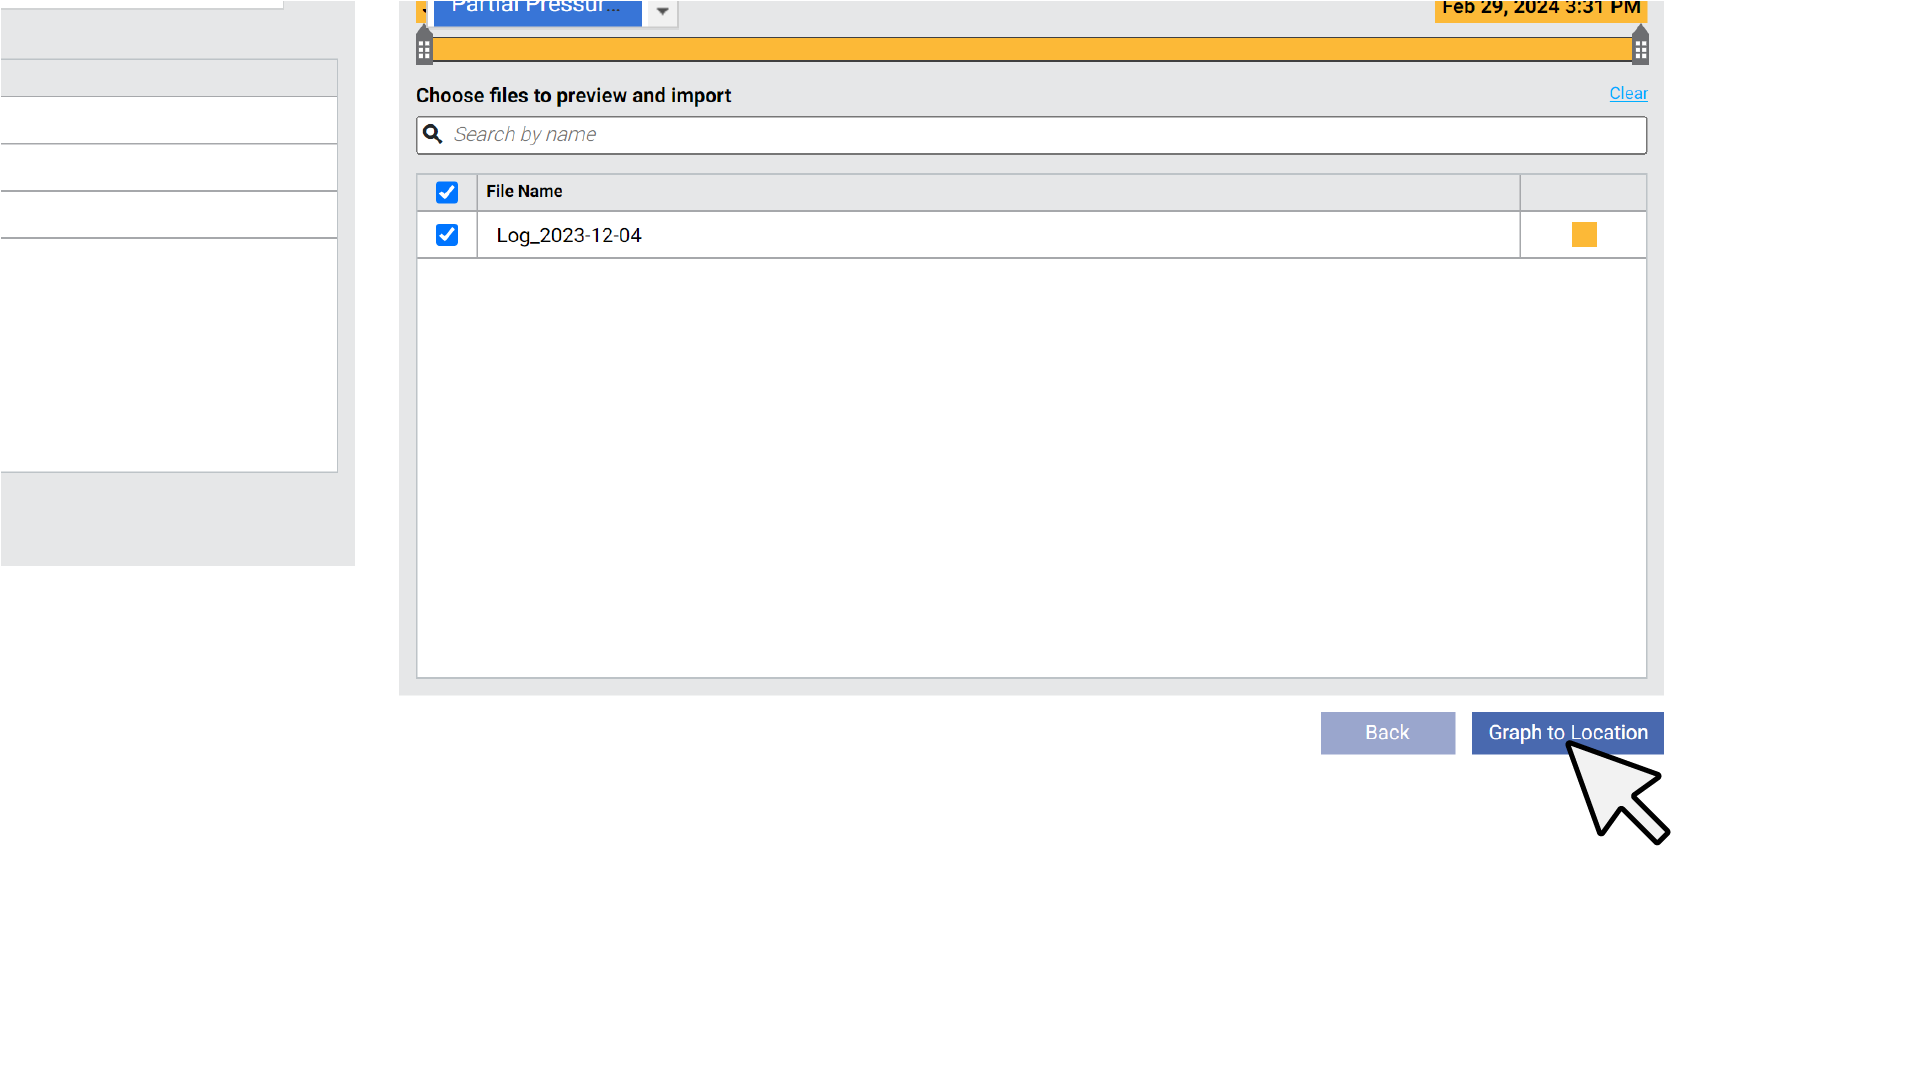
7. View the graphed data from the Data page.
Data is displayed at a maximum of 1 minute intervals. If your data file contains readings faster than 1 minute, it will be displayed on the graphs averaged at 1 minute intervals.
